Here’s a map-inspired trivia question for you. What US state is closest to Africa? Answer below.
Real estate appreciation rates are commonly stated on an annual basis. Here’s an uncommon look at appreciation by state since 1991.
National home prices are up 275% since then.
This is the same map that I discussed on the podcast recently, note the scale, orange is more appreciation, green is less:
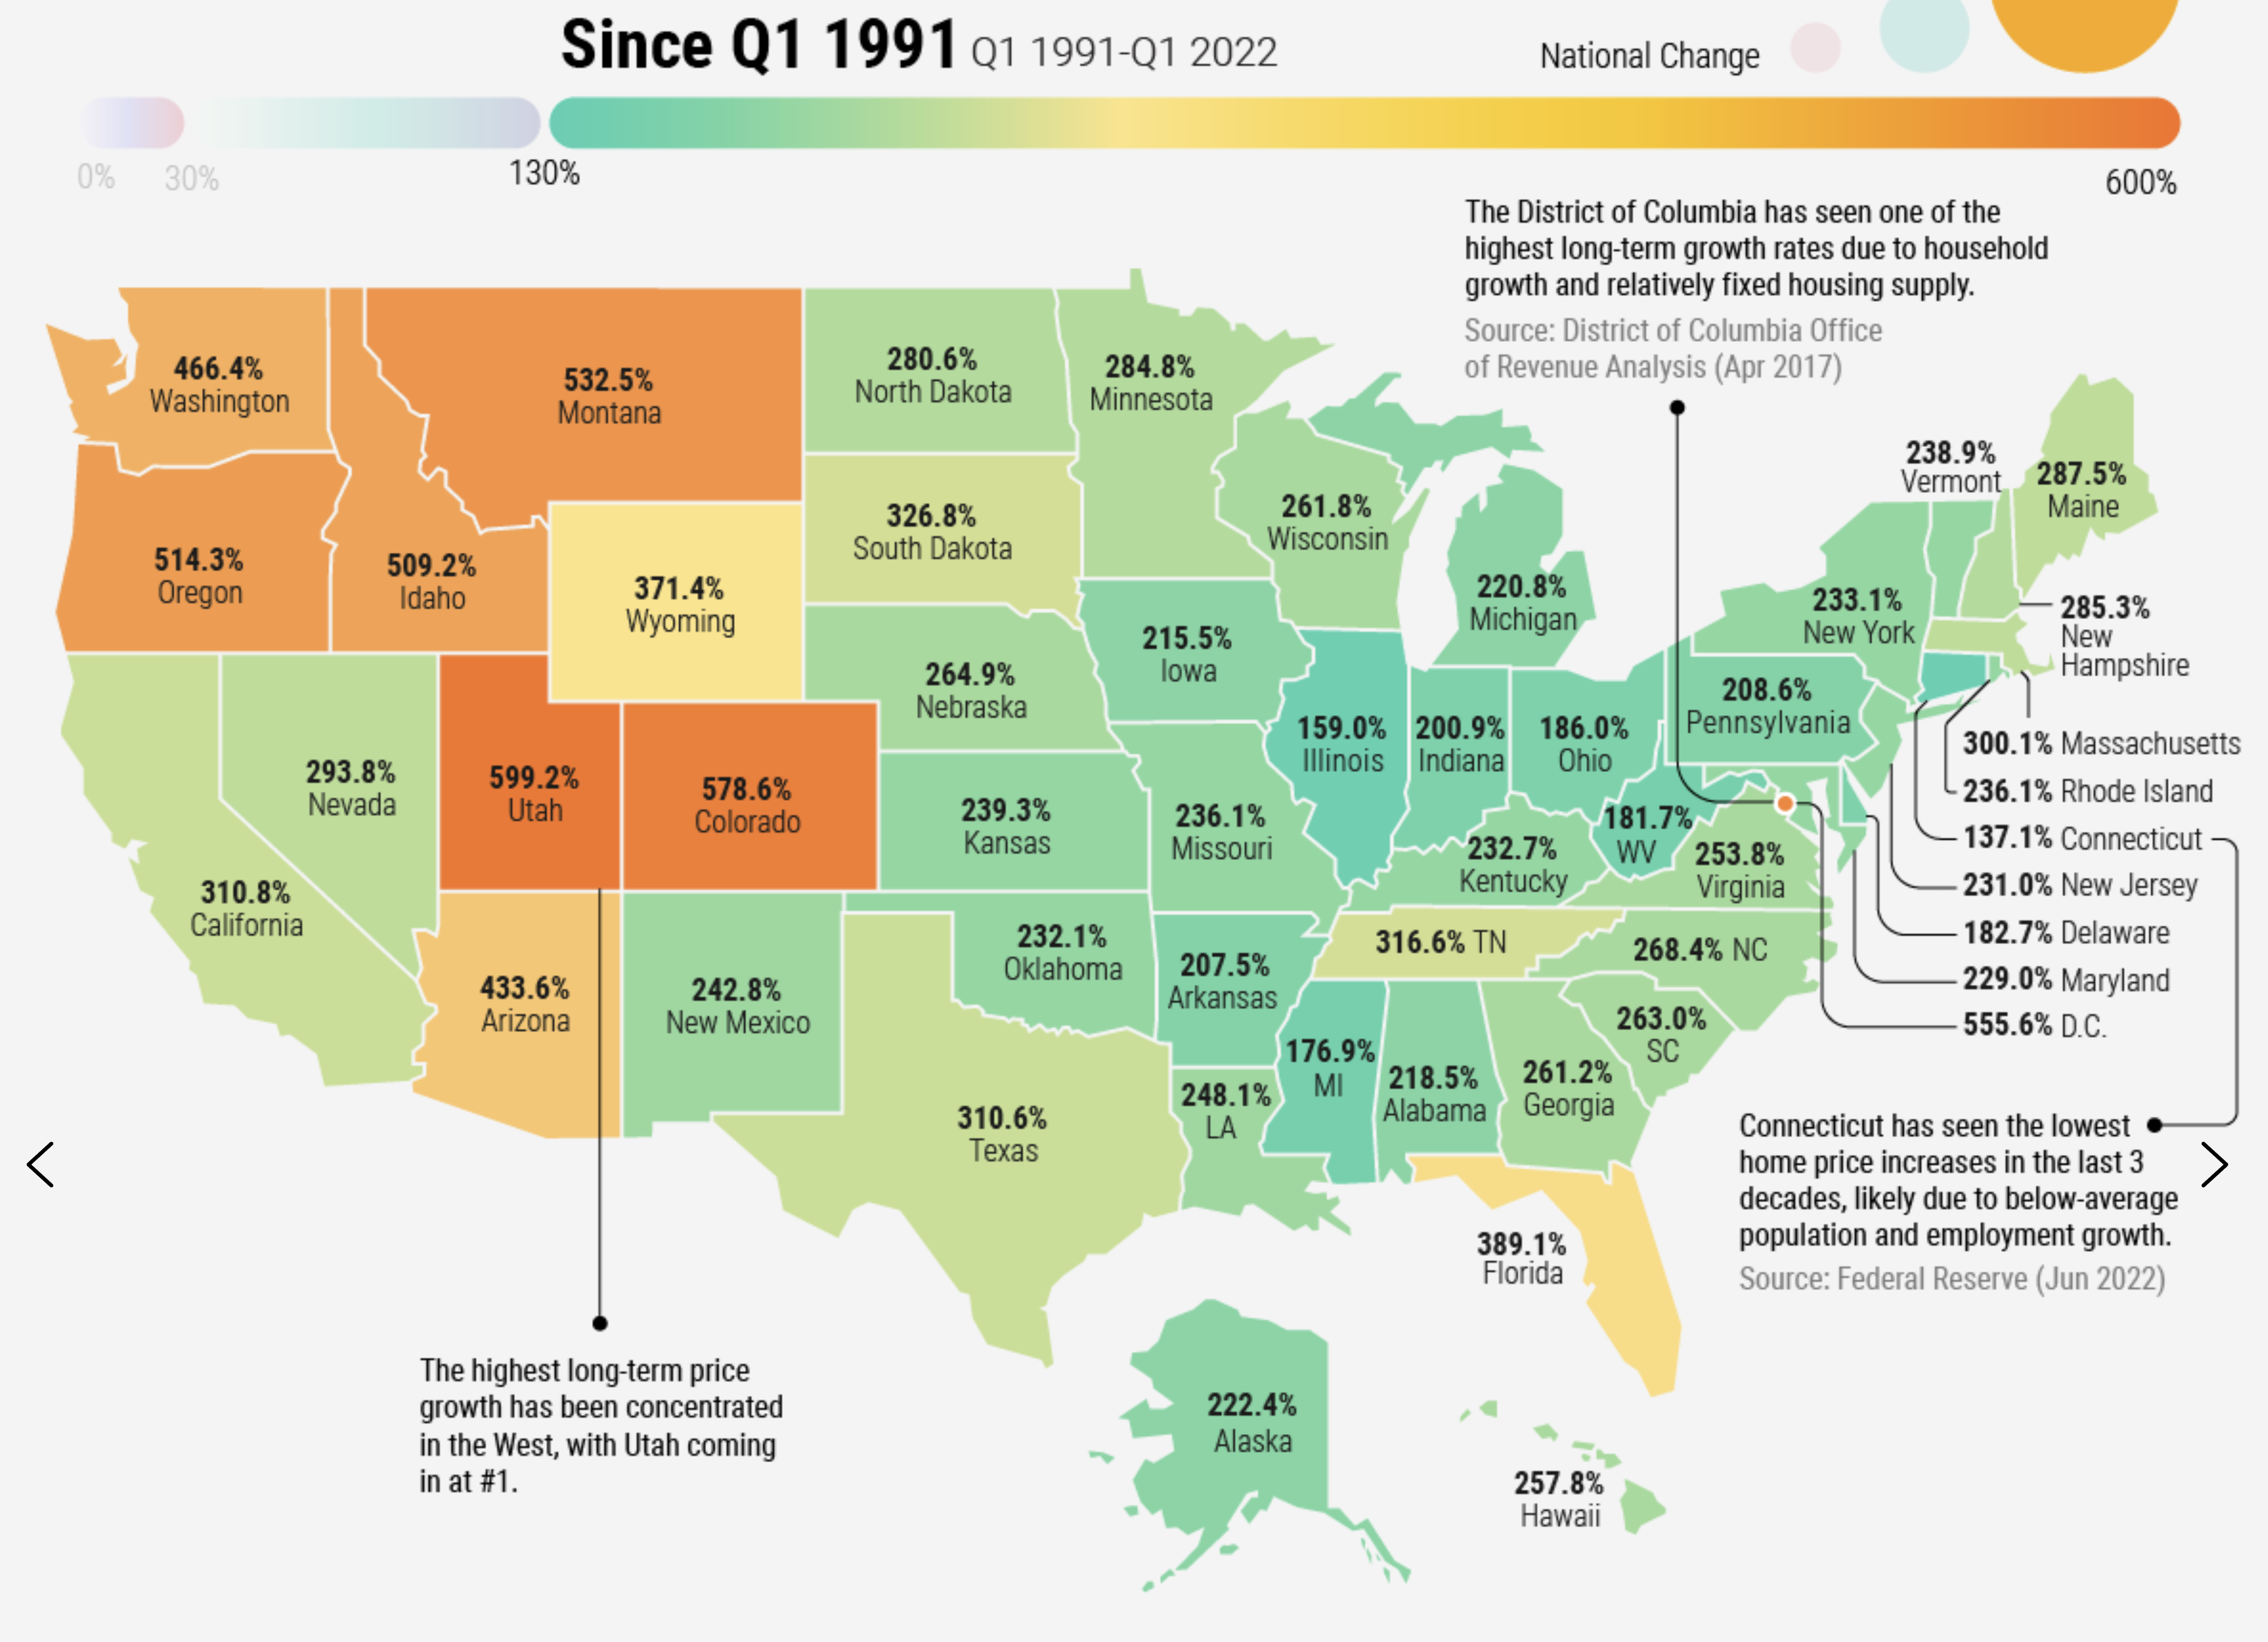 Designed by: Visual Capitalist. Source Data: FHFA House Price Index of weighted, repeat sales of single-family properties.
The .gif animation below overlays counties’ population growth on top of the appreciation map.
Note how appreciation correlates with population growth rate. The Intermountain West, Northwest, and Florida lead. Here’s some GRE-filtered context that laypeople don’t see:
- Not inflation-adjusted
- Within a state, appreciation varies by local area
- If your leverage ratio is 3:1, for example, South Carolina’s 263% appreciation means that your return is 789%
- In income property, this is just one of five profit centers
What a great map! It’s worth splashing onto an entire wall of your home. Your neighbors will clearly understand why you’re building an addition.
Thought getting your money to work for you creates wealth? It doesn’t! That’s a myth. My one-hour investing video course is now 100% free: Real Estate Pays 5 Ways. For a limited time, you can learn how wealth is really created, here.
Trivia answer: Maine